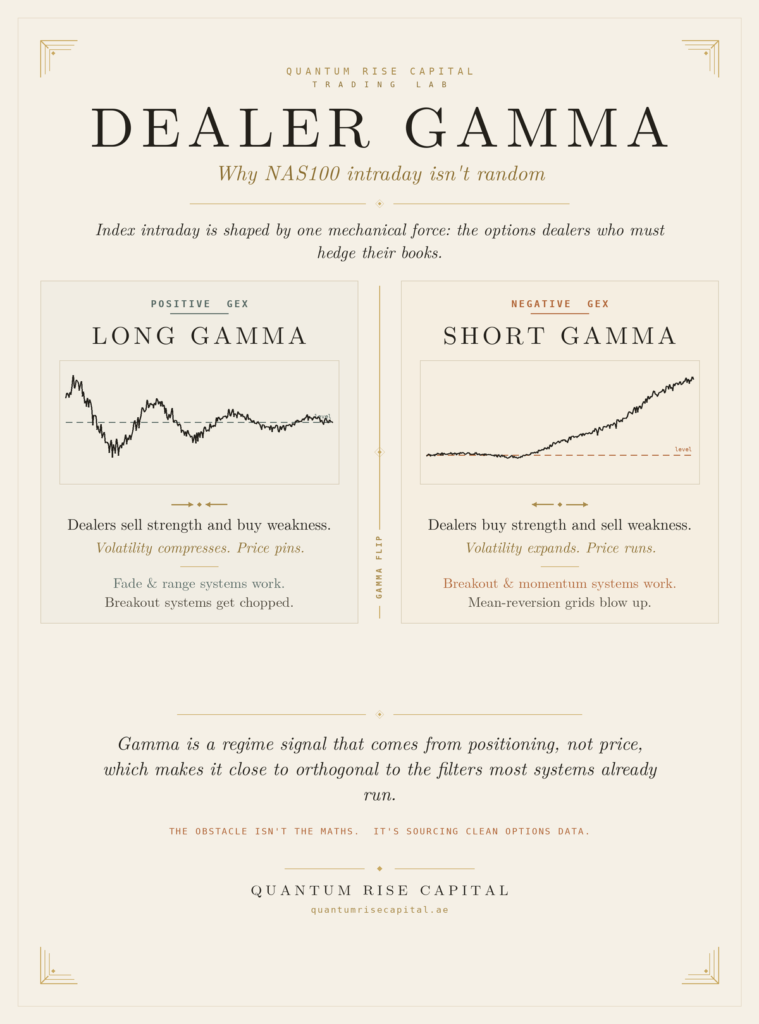
If you have traded NAS100 intraday for any length of time, you have seen both of these days. On one, price coils around a level like it is bolted there. Every push higher gets sold, every dip gets bought, and the range refuses to break no matter how many times it tests the edge. On another, a single move sets off a chain reaction. Price accelerates away from a level, the move feeds on itself, and the thing that looked like resistance an hour ago is now a distant memory.
Retail traders tend to file both days under “the market did what it wanted.” I understand the instinct, but it is wrong. A large part of that behavior comes from a mechanical source that has nothing to do with your indicators or your chart patterns. It comes from the people on the other side of the options market, and what they are forced to do to stay hedged.
That force is dealer gamma. Once you understand it, index intraday stops looking like noise and starts looking like something you can classify.
Who is hedging, and why it moves price
Understanding NAS100 Dealer Gamma
Options dealers, or market makers, take the other side of the options that everyone else buys and sells. When you buy a call on QQQ, someone sold it to you, and that someone does not want directional exposure. They want to earn the spread and stay neutral. So they hedge by buying or selling the underlying to offset the delta of the option they are holding.
The catch is that an option’s delta is not constant. It changes as the underlying moves. Gamma is the rate of that change. And because delta keeps moving, the dealer has to keep re-hedging. The direction of that re-hedging is the whole story.
Long gamma: the pinning days
When dealers are net long gamma, their hedging works against the move. As price rises, their position picks up positive delta, so they sell the underlying to get back to neutral. As price falls, they buy. Selling strength and buying weakness compresses the range. This is why some days feel magnetized to a level. The dealers are, in effect, running a mean reversion strategy for you, whether they want to or not.
For a systematic trader, long gamma days are where fade and range systems earn their keep, and where breakout systems get chopped to death. If your EA is built to buy new highs, a long gamma session is the environment most likely to hand you a string of false starts.
Short gamma: the acceleration days
Short gamma flips the sign. Now the dealers hedge with the move. As price rises, they buy. As it falls, they sell. Buying strength and selling weakness pours fuel on whatever direction the market has chosen. Volatility expands, moves extend further than they should, and stops get run in cascades.
These are the days momentum and breakout systems were designed for, and they are also where a mean reversion grid can quietly destroy an account. If you are fading a market while dealers are short gamma, you are standing in front of a flow that gets stronger the more wrong you are.
The flip level
Aggregate all of that dealer gamma across every strike and you get a single number, often called GEX, or gamma exposure. When it is positive, the market sits in the pinning regime. When it is negative, it is in the acceleration regime. The price at which it crosses zero is the gamma flip, and it tends to behave like a regime boundary. Above it, expect stability. Below it, expect trouble. It is not a hard line, but it is a useful one.
There is also the strike-level detail. Large concentrations of gamma at specific strikes act like magnets into expiry, which is part of why price so often gravitates toward round numbers on OPEX days. None of this is superstition. It is inventory management by people with billions on the line.
Why this belongs in a trading system
Gamma is a regime signal that does not come from price. Most regime detection, whether that is an ATR filter or an HMM fitted to returns, reads the market’s own history and infers state from it. Gamma reads positioning instead. That makes it close to orthogonal to the signals most EAs already use, and orthogonal information is the rare kind that improves a system rather than just re-describing what you already know.
Used as an overlay, a gamma regime flag answers a question your price-based logic cannot: is the flow underneath this market going to dampen my trade or amplify it? Run your mean reversion book when dealers are long gamma. Give your breakout logic room when they are short. Sit on your hands when the flow disagrees with your setup.
The honest part
Gamma is a tilt, not a switch. Dealers are not the only participants, positioning estimates rest on assumptions about who holds what, and a big enough macro catalyst will overwhelm the mechanical flow entirely. Treat it as one probabilistic input among several, not a crystal ball.
And there is a practical wall that anyone who has tried to build this will hit immediately: data. Estimating dealer gamma for NAS100 means working with the NDX and QQQ options chains, and clean options data is neither cheap nor easy to source. You either start collecting it live and wait, or you pay for history. That decision, more than the math, is usually what separates people who talk about gamma from people who trade on it.
We treat index intraday as regime-conditional for exactly these reasons. The market is not doing what it wants. It is doing what a few large hedgers are required to do, and that is something you can measure, classify, and build around.
