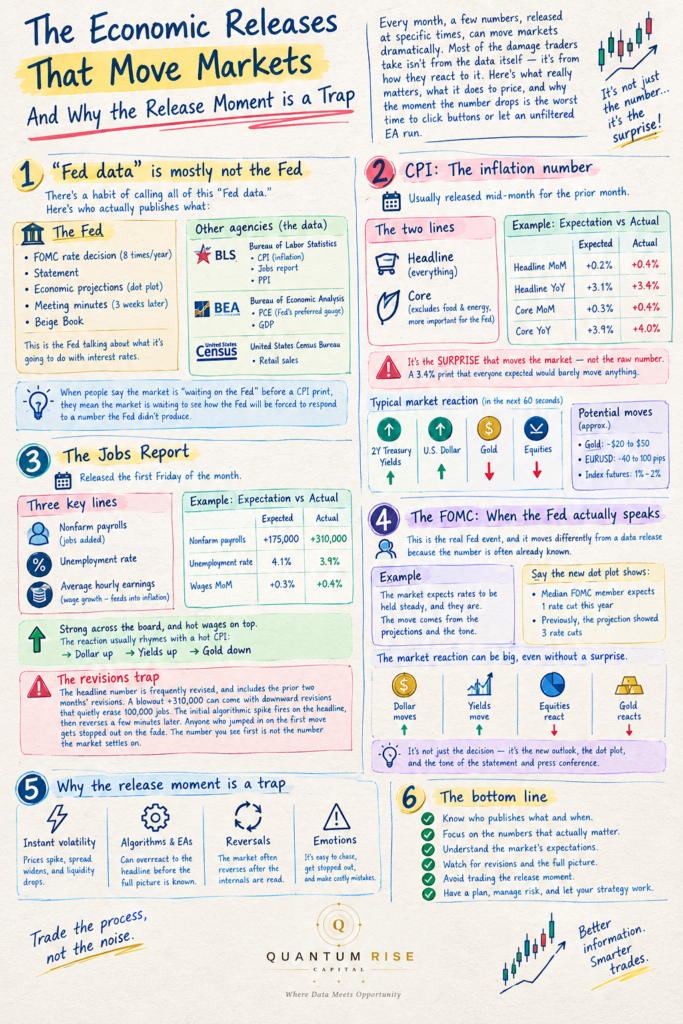
Every month there are a few minutes where a single number, printed at 8:30 in the morning, decides whether your open positions are fine or bleeding. Traders call it “the news.” Most of the damage people take from it is self-inflicted, because they treat the release as an opportunity instead of a hazard. This is a walk through the releases that actually matter, what they do to price, and why the moment the number drops is the worst possible time to be clicking buttons or letting an unfiltered EA run.
“Fed data” is mostly not the Fed
There’s a habit of calling all of this “Fed data,” and it’s worth killing early, because knowing who publishes what tells you when to look and what the number means.
The Federal Reserve publishes the FOMC rate decision (eight times a year), the accompanying statement, the quarterly economic projections that include the dot plot, the meeting minutes three weeks later, and the Beige Book. That’s the Fed talking about what it’s going to do with interest rates.
Everything else on the high-impact calendar is the data the Fed reacts to, and it comes from other agencies. The Bureau of Labor Statistics publishes CPI (inflation) and the monthly jobs report, plus PPI. The Bureau of Economic Analysis publishes PCE, which is the Fed’s preferred inflation gauge, and GDP. The Census Bureau handles retail sales. When people say the market is “waiting on the Fed” before a CPI print, they mean the market is waiting to see how the Fed will be forced to respond to a number the Fed didn’t produce.
CPI: the inflation number
CPI is usually the single biggest scheduled mover in a normal month. It comes out around the middle of the month for the prior month, and there are two lines that matter: headline (everything) and core (stripping out food and energy, because those are volatile and the Fed cares more about the underlying trend).
Here’s the mechanism, with numbers. Suppose the consensus going in is headline +0.2% month-over-month and +3.1% year-over-year, with core at +0.3% and +3.9%. That expectation is already baked into current prices. Now the actual print lands hot: headline +0.4% and +3.4%, core +0.4% and +4.0%.
Inflation is stickier than the market assumed. The read-through is that the Fed has to stay restrictive for longer, so traders reprice rate-cut expectations, pushing cuts further out or pricing in fewer of them. Watch what happens across assets in the next sixty seconds. Short-dated Treasury yields (the 2-year) jump. The dollar rallies. Gold sells off hard, because higher yields raise the opportunity cost of holding metal that pays no interest and a stronger dollar makes it more expensive. Equity indices drop, since higher-for-longer rates compress the valuations of everything priced off future earnings. On a surprise that size, gold can drop 20 to 50 dollars in minutes, EURUSD can fall 40 to 100 pips, and index futures can move one to two percent.
Notice the important part: none of that was driven by the number being 3.4%. It was driven by 3.4% versus an expected 3.1%. The market trades the surprise, the gap between actual and consensus, not the raw figure. A 3.4% print that everyone expected would barely move anything. This is why “the economy is doing well, so stocks should go up” reasoning gets people run over. Price already contains the expectation. Only the miss moves it.
The jobs report
The Employment Situation report, out on the first Friday of the month, is the other heavyweight. Three lines carry it: nonfarm payrolls (jobs added), the unemployment rate, and average hourly earnings (wage growth, which is the piece that feeds back into inflation).
Say consensus is +175,000 jobs, unemployment at 4.1%, and wages +0.3% month-over-month. The print comes in at +310,000, unemployment 3.9%, wages +0.4%. Strong across the board, and hot wages on top. The reaction usually rhymes with a hot CPI: dollar up, yields up, gold down, because a tight labor market gives the Fed room to stay restrictive.
But the jobs report has a trap that CPI mostly doesn’t, and it’s worth teaching your readers explicitly. The headline number is frequently revised, and the report includes revisions to the prior two months buried underneath it. A blowout +310,000 headline can arrive alongside downward revisions that quietly erase 100,000 jobs from previous months. The initial algorithmic spike fires on the headline, then reverses a few minutes later once desks read the internals. Anyone who jumped in on the first move, thinking they’d read the direction correctly, gets stopped out on the fade. The number you see first is not the number the market settles on.
The FOMC: when the Fed actually speaks
This is the real Fed event, and it moves differently from a data release because the number is often already known.
Take a meeting where the market fully expects rates to be held steady, and they are. Nothing there. The move comes from the projections and the tone. Suppose the new dot plot shows the median FOMC member now expects one rate cut this year, when the prior projection showed three. That’s a hawkish hold: the Fed kept rates the same but signaled a slower path down than the market was positioned for. Dollar up, yields up, gold and equities down, even though the headline decision was a non-event.
Then it moves a second time. The statement and projections land at 2:00 PM, and Powell’s press conference starts at 2:30. The presser regularly reverses the initial reaction. The dots look hawkish, gold drops, and then Powell strikes a softer tone in the Q&A and half of it comes back. So you get two separate volatility events thirty minutes apart, both capable of whipsawing you, on a day where “nothing happened” to the actual rate. FOMC afternoons are a whipsaw factory, and they’re the clearest case of why the number itself is not the thing that moves price.
PCE and GDP round out the calendar. PCE matters because it’s what the Fed actually targets, so a PCE surprise can carry more weight than the headlines suggest, even though it gets less retail attention. GDP moves markets on large misses but is usually a slower burn than CPI or payrolls.
Why you don’t want to be in the market at the print
Here’s the part that the “I’ll just trade the spike” crowd learns the expensive way. The problem isn’t predicting direction. Even if you called it right, the execution environment during the release is built to take money from you.
Spreads blow out. A pair that trades at a 0.3 pip spread all day can widen to 5, 10, 20 pips or more in the seconds around the release, because liquidity providers pull their quotes rather than get run over by a number they can’t predict. Gold’s spread can go from 15 cents to several dollars. You are now paying that spread on entry and exit, and it can be larger than the move you were trying to catch.
Slippage turns your stop into a suggestion. A stop-loss is an order to sell at the market once a price is touched, not a guarantee you’ll get that price. When the print gaps the market, price jumps straight through your level with no fills in between. You set a stop on a long EURUSD at 1.0850; the number drops, price gaps from 1.0862 to 1.0841, and you fill at 1.0838. That’s 12 pips of slippage past where you thought your risk ended. Multiply that across a leveraged position and your carefully sized 1% risk becomes 2% or 3%.
Then there’s the two-way whipsaw. Price often spikes one direction, reverses through its starting point, and spikes the other way, all inside a few seconds, before it decides where it actually wants to go. It’s entirely possible to get stopped out on both sides of the same release. The initial move is frequently the wrong one.
The part that matters for algos
This is the one I’d hammer hardest for a QRC audience, because it hides inside otherwise clean backtests. The tick data most MT5 backtests run on does not model the real spread blowout and slippage during high-impact releases. So an EA that appears to profit from news spikes in a backtest is often trading a fiction. In the historical data the fills look tight and the moves look clean; live, the same trades fill far worse, the widened spread eats the edge, and slippage flips winners into losers. If your optimizer isn’t excluding news windows, it will happily curve-fit to those phantom moves and hand you a strategy whose reported edge evaporates the moment real money hits real liquidity. A strategy that trades through releases needs to be validated against realistic execution assumptions, or the backtest is lying to you.
The part that matters for prop challenges
For anyone running an FTMO or The5ers evaluation, the release moment is not just risky, it can disqualify you outright. A single news spike with slippage can breach a daily loss limit or max drawdown in seconds, and a breach ends the account regardless of how profitable it was the day before. On top of that, many prop firms restrict or prohibit opening and closing trades within a window around high-impact news, often a couple of minutes on either side. Break that rule and a payout can be voided even on a passing account. So on a challenge, trading the print risks your drawdown and your eligibility at the same time.
What to do instead
The whole point is to be flat, or already positioned and prepared to sit through noise, when the number lands, and to act on the real move once conditions normalize.
- Keep an economic calendar open (ForexFactory, Myfxbook, investing.com) and mark the high-impact, red-folder events. Know when CPI, the jobs report, and FOMC land in your session, in your broker’s time zone.
- Build a news filter into every EA. Block new entries in a window around high-impact releases, and decide in advance whether the EA should flatten, hold, or widen stops through it. FOMC, CPI, and NFP usually deserve a wider block than second-tier data.
- Wait for the spread to come back to normal and the first whipsaw to settle before acting on a directional view. The move that holds usually establishes itself 15 to 30 minutes after the print, not in the first ten seconds.
- In backtesting and optimization, flag or exclude news windows and model realistic spread and slippage, so your reported edge isn’t built on fills you’ll never actually get.
The traders who consistently lose money to data releases aren’t the ones who read the numbers wrong. They’re the ones who insist on being in the market at the exact moment liquidity disappears. Sit the ten minutes out. The move will still be there when the spread is back to normal, and so will your account.
