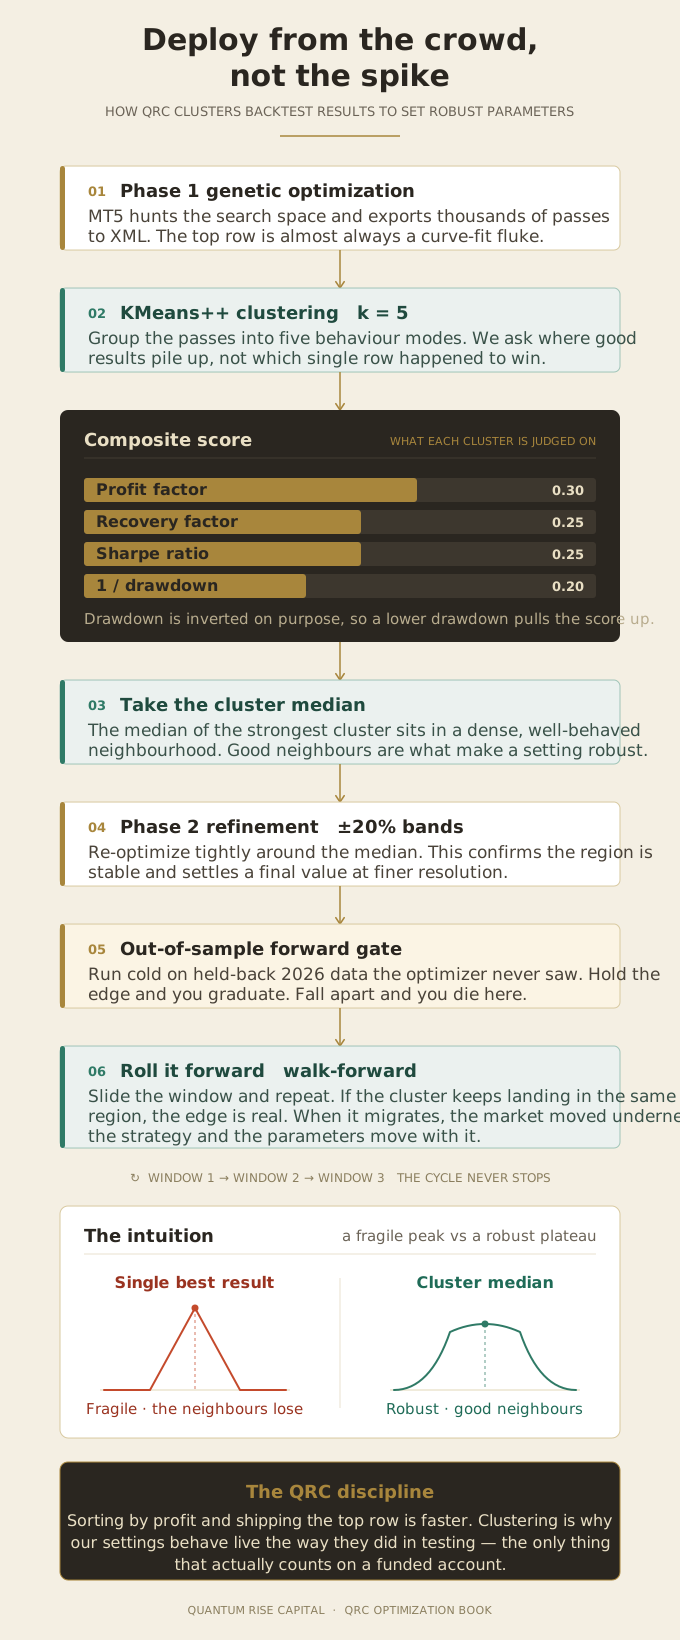
If you’ve optimized an EA in MetaTrader 5, you know the trap. You run a few thousand passes, sort by profit, and the top row stares back at you with a 4.2 profit factor and a recovery factor that looks too good to be honest. It usually is. That single row is almost always a curve-fit ghost. Drop one parameter by 5% in either direction and the whole thing falls apart. Rather than chasing the best Backtest result, we focus on clustering.
At QRC we stopped trusting the top of the sorted list a long time ago. Instead we run every optimization through a KMeans clustering step. This post walks through what that actually does and why it’s become the spine of how we set parameters across the fleet.
This approach allows us to avoid the pitfalls of relying on a single Backtest result.
The problem with the best result
MT5’s genetic optimizer is good at its job, which is part of the problem. It hunts for the highest score in your search space, and if there’s a tiny island of parameters that happened to nail the exact wiggles of your historical data, it will find that island and plant a flag on it. The optimizer doesn’t know the difference between a real edge and a coincidence. It just knows the number went up.
What you want is not the single best pass. You want a region of the parameter space where most of the settings around your chosen point also perform well. A robust setting has good neighbors. A fragile one is surrounded by losers and it’s only a matter of time before live conditions push you off the peak.
That is the whole idea behind clustering. We’re not asking “which row won.” We’re asking “where do the good rows pile up.”
How the clustering step works
After Phase 1 optimization finishes, we export the full results to XML and pull them into a Python pipeline. Every pass becomes a point described by its performance metrics. Then we run KMeans++ to group those points into clusters, and we use k=5.
Why five? It’s enough to separate genuinely distinct behavior modes without slicing the data so thin that every cluster is noise. Some EAs naturally fall into a handful of regimes during optimization. One cluster might be high-frequency and low-profit-per-trade, another might be patient and lumpy. Five tends to capture that without overfitting the grouping itself.
Each point gets a composite score before clustering, weighted like this:
- Profit factor at 0.30
- Recovery factor at 0.25
- Sharpe at 0.25
- The inverse of drawdown at 0.20
The drawdown term is inverted on purpose. Lower drawdown should pull the score up, so 1/DD does the work. The weights aren’t arbitrary either. Profit factor gets the most because it’s the cleanest read on whether the strategy actually makes money per unit of risk taken. Recovery and Sharpe split the middle because we care about how the equity curve behaves, not just where it ends. And drawdown gets a real seat at the table because a strategy that makes 40% but bleeds 35% on the way is not something we’ll ever run on a funded account.
Once the clusters are formed, we ignore the flashy outliers and go to the median of the strongest cluster. The median, not the best member. A cluster median represents a setting that sits in the middle of a dense, well-behaved neighborhood. Its neighbors are good. That’s the kind of parameter set that tends to survive contact with live markets.
Phase 2: refining around the median
Taking the cluster median gives us a center of gravity. Phase 2 is where we tighten the focus.
We build a new optimization around those median values with bands of plus or minus 20% on each parameter. So if Phase 1 clustering pointed us at an ATR multiplier of 2.0, Phase 2 sweeps roughly 1.6 to 2.4 around it. This does two things. It confirms the region is stable rather than a fluke, and it lets us settle on a final value with finer resolution than the broad first pass allowed.
If Phase 2 produces another tight, sensible cluster around the same area, that’s a good sign. If the results scatter or the best Phase 2 settings drift to the edge of the band, that tells us the Phase 1 median was sitting closer to a cliff than we’d like, and we treat the strategy with more suspicion.
The forward-test gate
None of this matters if it only works on the data it was trained on. Clustering reduces overfitting but it doesn’t eliminate it, so every candidate has to clear an out-of-sample test before it goes anywhere near a challenge.
We hold back recent data the optimizer never touched, currently 2026 price action, and run the Phase 2 settings on it cold. The question is simple: does the edge hold on data it has never seen? If the forward test confirms the in-sample behavior, the setting graduates. If it falls apart out of sample, it dies here, no matter how pretty the backtest looked. This gate has killed plenty of EAs that looked like winners on paper, and we’re glad it did.
Rolling the optimization forward
Markets drift. Volatility regimes shift, spreads change, the character of an instrument in 2024 is not the character it has now. A parameter set that was robust eighteen months ago can quietly go stale, so we don’t treat optimization as a one-time event. We roll it.
The approach is a walk-forward in spirit. We re-run the full cycle on a moving window of data, advancing the in-sample and out-of-sample periods over time rather than locking in one historical fit forever. Optimize on a window, cluster, take the median, forward-test on the period that follows, then slide everything forward and do it again. If the cluster keeps landing in roughly the same parameter region across successive windows, that’s strong evidence the edge is real and not an artifact of one lucky stretch of history. When the robust region starts migrating window to window, that migration is the signal. It means the market has changed underneath the strategy and the parameters need to move with it.
This is also how we catch decay before it costs us. A setting that was clustering tightly and then suddenly scatters across windows is telling us something. We’d rather hear that from a rolling test than from a blown drawdown limit on a live account.
Why we bother
The honest answer is that the single-best-result approach burned us enough times that we needed a discipline to protect us from our own optimizers. Clustering forces us to deploy from the middle of a crowd instead of the tip of a spike. The composite score makes sure we’re rewarding the right behavior. The forward gate keeps us honest about overfitting. And rolling the whole thing forward keeps the parameters honest as the market moves.
It’s slower than sorting by profit and shipping the top row. It’s also the reason our settings tend to behave roughly the same way live as they did in testing, which on a funded account is the only thing that actually counts.
